I am on a mission to learn and master Deltek Acumen Fuse software and I am bringing you along for the ride.
Deltek Acumen Fuse is a powerhouse app that becomes an incredible tool in your arsenal if you’re doing P6 scheduling all the time and getting hammered by people who are analyzing it on the other end.
So, I’m going to teach you how to get the best use out of Acumen Fuse.
In this post, we are talking about how to use Acumen Fuse for analyzing relationships.
How do we analyze the logic of a Primavera P6 schedule?
Was it built well? What went wrong? Too many Start-to-Start relationships?
Let’s start!
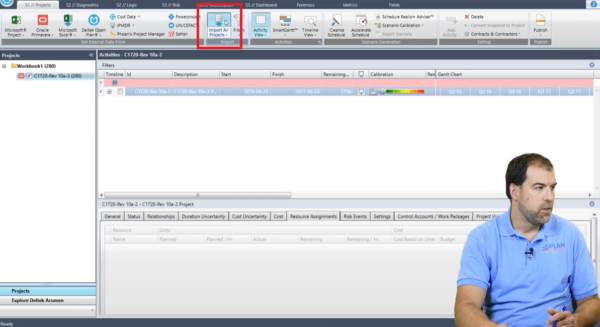
First, on the projects screen “S1 // Projects” I hit the “Import All Projects” tab and pulled in my P6 project “CT720”.
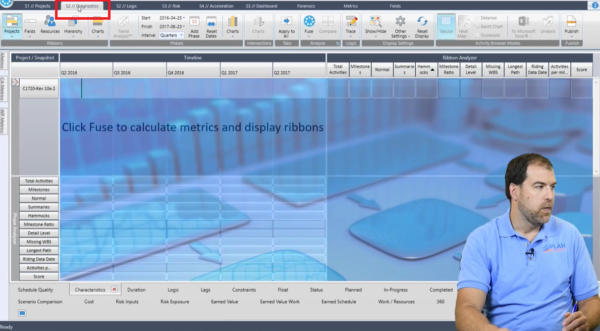
From here, I want to start on the diagnostics screen “S2 // Diagnostics”.
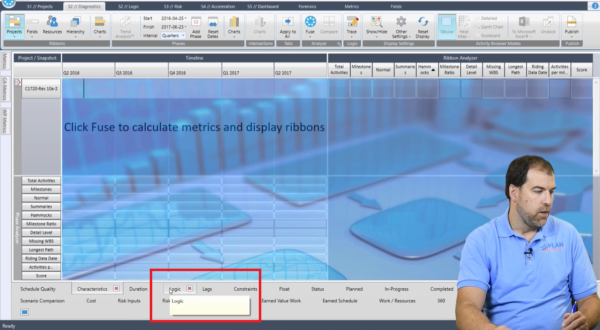
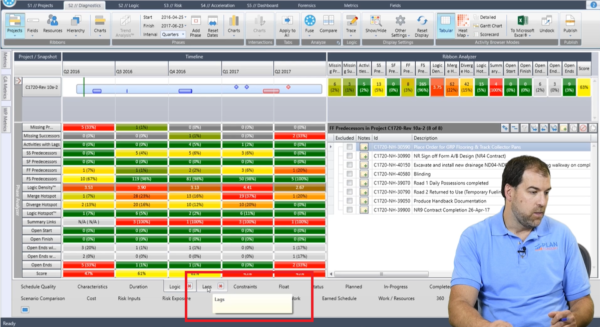
At the bottom of this screen, I want to check the logic tab to get a logic report. So, in the bottom bar click the “Logic” tab.
To get Deltek to do it, I need to click “Fuse”.
Wow! Look at the analysis coming back here! Its incredible!
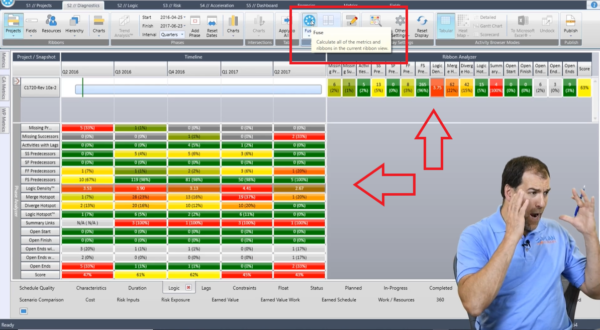
I have said before that Deltek Acumen Fuse is almost like sitting in the cockpit of a 747. There’s lots of stuff coming at you and you wonder how do you make it take off?
So same thing here – now once again we’ve seen this kind of ribbon analyzer screen before in our previous post. But, let me just remind you how this works.
So, here’s my project and the timeline of the project and it’s broken into these quarters and years.
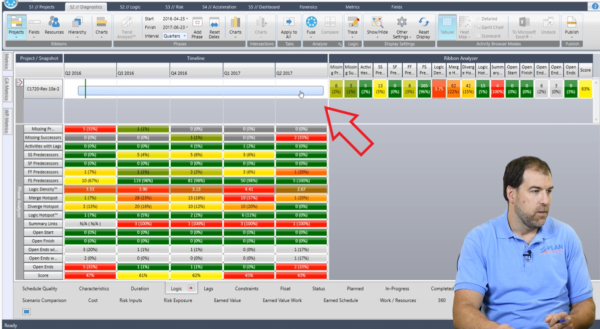
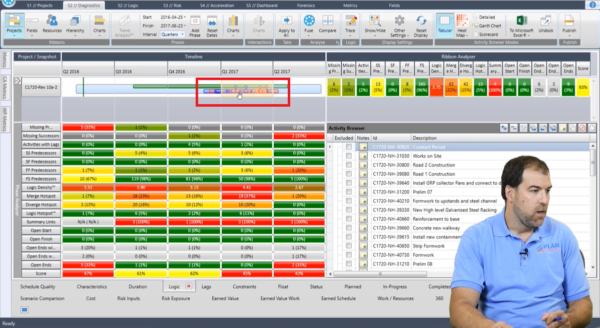
These are the results on the bottom of each quarter. So, for example if I wanted to dig into Q1 2017, I can click here and I get nice visuals that show me milestones, where critical activities are happening, what’s going on and I can also look into all the analysis for that particular slice of the project right here.
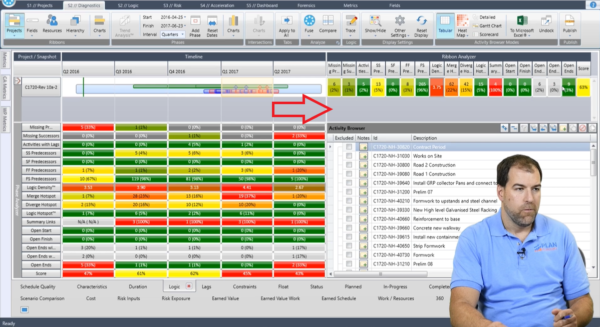
On the right-hand side, I get the full gamut of the project – Open Ends, Open Starts, Logic Hotspots, Summary Links, all this great stuff.
And now let’s say I did want to dig in more deeply into “SS Predecessors” – show me activities that have a Start-to-Start predecessors. I can click on the header and in the bottom right window, I get the slice of results.
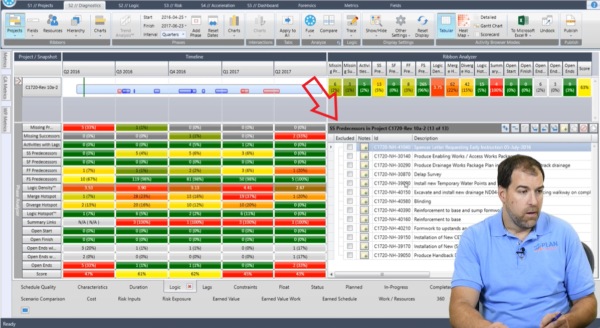
Now this is cool – I can quickly dig in and find all the activities that have Start-to-Start relationships. I may want to scrutinize those.
I can do the same here with Finish-to-Finish predecessors. So quickly finding all the activities that have that kind of relationship.
Now taking this even a step further because there’s a lot of options in Deltek Acumen Fuse. What I can do is I can actually undock this window to reveal more details. Click “Undock” tab up on the right-hand corner of the screen.
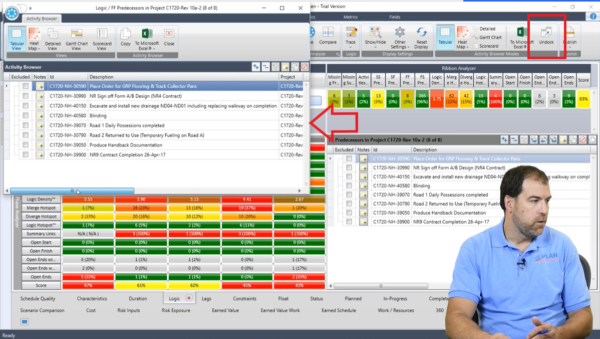
So, analyzing my relationships is very easy.
One of the things I love to analyze is lags and leads, but I am not seeing any in the “Project Snapshot” window.
That’s not in this window but have a look in the bottom bar and you’ll find a tab for “Lags”. Now let’s hit “Fuse” in the top bar. You hit “Fuse” to calculate metrics and display ribbons.
Here I can see all the lags and where they lineup. So, I have three lags and you can see them expanded in the bottom right window. I can see Leads, Hidden Duration, and other interesting metrics. I can also see the number of activities that contain a lag.
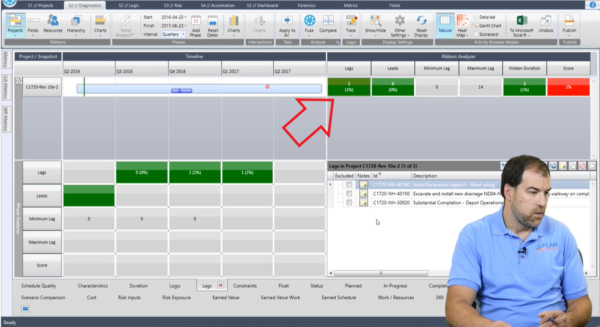
Hidden Duration is the number of activities that contain a lag that is bigger than 35% of its original duration. So here am I burying duration in lags by having very large lags? Interesting!
There’s lots to explore here and this is how we can use the diagnostic screen to dig into all my logic issues.
Now there’s a little bit more – another screen that we want to explore here. And that is the “S2 // Logic” screen at the top.
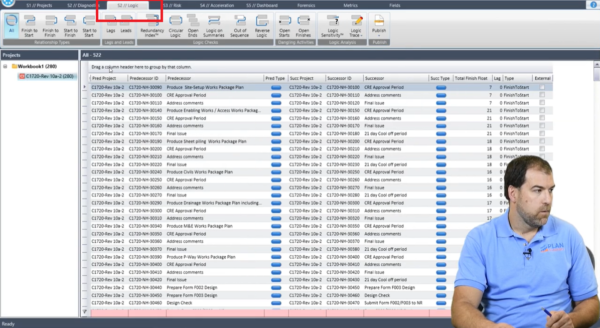
The logic tab allows me to do a lot of that filtering and slicing and dicing, but it’s a little bit simpler to use – in my opinion.
This reminds me of an application that I used before called Change Inspector and this is Change Inspector on steroids!
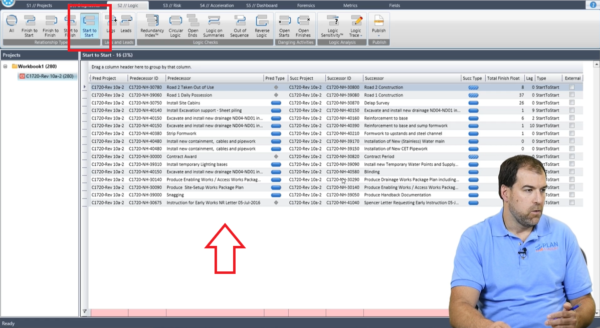
For example, we can quickly click in the top bar “Start to Start” and see all the start-to-start activities listed here. Its very quick and very easy to do. We can also click the “Open Ends” tab to find all the open-ended activities. Really quick and easy to slice and dice.
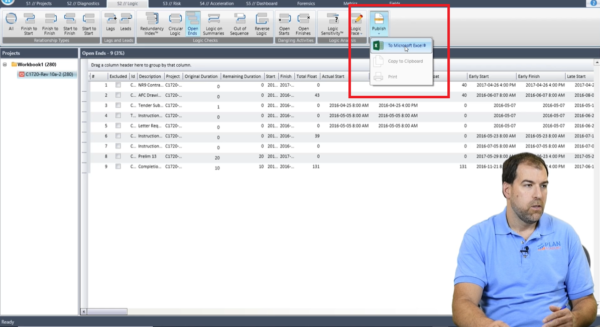
I can also publish the data by hitting “Publish” in the top bar and choose Excel – send it out, hold on to it, and even do some digging in P6 to fix those issues. Or crank it out into excel and put it into a report as part of my narrative for example of analysis.
More In-Depth Logic Tools:
There’s even something called “Logic Sensitivity” in the top bar of the “S2 // Logic” tab, which I found interesting.
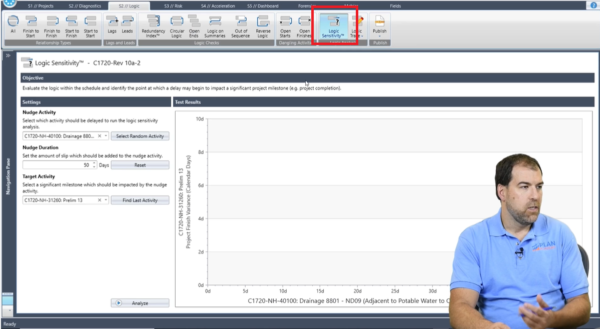
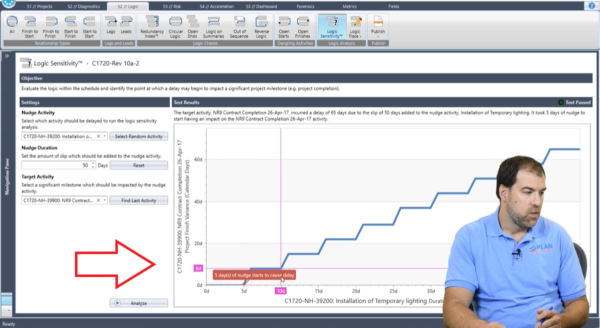
It is a way for us to run a little diagnostic on how sensitive my project is to delays. So, for example here in the “Settings” window, if I nudge an activity and I selected a random activity and if I nudge it up to 50 days, and I want to see the result of this nudge on the shown finish milestone. I run the analysis and as I do that, and again this is a fairly random example here, but you can see that 5 days of nudge starts to cause a delay.
You can see how increasing and nudging activities more and more is causing more delays.
So, there’s all sorts of interesting tools in this that you can explore as well.
There you have it – that’s how you can use some of the tools in Deltek Acumen Fuse to analyze relationships
More to come on Deltek Acumen Fuse. Stay tuned.


