
Power BI is a powerful business analytics tool that transforms data into interactive, visually compelling insights. By integrating with tools like Primavera P6 and leveraging Excel as a mediator, it enhances project management reporting and decision-making through advanced visualization and data analysis. Leading up to the launch of our new on-demand course Power BI Foundations for Project Controls, in this post we’re talking about transforming data in BI into dynamic reports.
What is Power BI
Power BI is a suite of tools that transforms various data sources into interactive and visually engaging insights. It connects to data from Excel, cloud, or on-premises warehouses, allowing easy visualization and sharing of key information.

Power BI Workflow
A typical Power BI workflow starts with connecting to data sources in BI Desktop and creating a report. This report is then published to the BI service, where it can be shared for users to view and interact with on the web or mobile devices. This process highlights how the three core BI components work together seamlessly.
Popularity
At the Microsoft Data Insight Summit, it unveiled new Power BI features that enhance data analysis and sharing, including improved enterprise readiness, deeper Excel integration, and smarter data exploration. The summit focuses on empowering business analysts and data professionals to turn data into actionable insights and leverage modern BI tools. They also celebrated Power BI reaching over 5 million subscribers, reflecting its rapid growth amidst the increasing data volumes, which IDC projects could surpass 50 zettabytes by 2020.
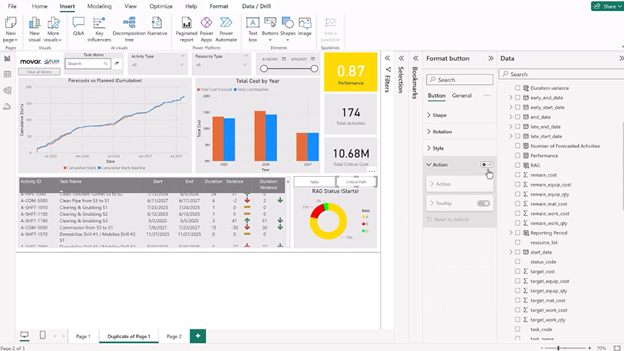
Integration with Primavera P6
In project management, data-driven decisions are essential for success. Primavera P6 is a top tool for planning and managing complex projects, but its reporting and visualization features can be limited. Integrating Primavera P6 with Power BI enhances data visualization and provides deeper insights, enabling better decision-making.
Integrating Primavera P6 with Power BI using Excel as a mediator is a practical approach to leverage the strengths of both tools for enhanced project management insights. Here’s a simplified workflow to achieve this integration:
- Export Data from Primavera P6
- Prepare the Data in Excel
- Import Excel Data into Power BI
- Create Data Models and Visualizations
- Publish and Share Reports
Benefits of using Excel as a Mediator
- Ease of Use: Excel is familiar to most users, making the integration process straightforward without the need for complex programming.
- Flexibility: Excel allows for additional data manipulation and preparation before importing it into Power BI.
- Cost-Effective: Utilizing Excel as a mediator avoids the need for expensive direct connectors or additional integration software.
Using Excel as a bridge between Primavera P6 and Power BI offers a simple yet effective way to enhance project management reporting and visualization. This integration provides project teams with better insights and helps them make more informed decisions to drive project success.